1. Home
  2. Features
  3. Living Property Map
Living Property Map · Built into the Client HubEvery plan

Customer portals built around the property, not the invoice

Every customer gets a satellite map of their own yard inside the Client Hub — with service zones, tagged plants, before/after photos, treatment history, and a vertical timeline scrub to rewind the property to any date. Built into every plan, from Starter on up.

Satellite + hybrid view Service zone overlays Plant tagging Before/after slider Treatment overlays Timeline scrub
A landscaped front yard with mature shade trees and a flowering perennial border in front of a Victorian-era home, viewed through a white picket fence.
Why this changes the relationship

Every other customer portal is a list of past invoices.

That's table stakes for billing — but it does nothing for retention, referrals, or the relationship between visits. The Living Property Map turns the property record itself into the centerpiece.

Static portals don't reduce churn

A list of paid invoices gives a customer no reason to keep logging in — and no reason to choose you again next year. Switching costs feel like zero.

Photos disappear into camera rolls

Crews capture before / after / progress shots all season. Without a property surface, those moments live in DMs and emails — and never reach the homeowner who'd brag to their neighbor about them.

The relationship fades between visits

Months pass between service calls. Customers forget what was treated, what was warrantied, and what's coming next. The property map keeps the relationship in their pocket.

What's on the map

Five toggleable layers, one satellite view

A Google Maps hybrid view (satellite imagery + road labels) centered on the customer's actual property. Layers light up on toggle; the timeline scrub on the right rewinds them all to any date.

Layer reference

Service zones

Polygon overlays sourced from accepted estimate zones — colored by zone type.

Tagged plants

Color-coded markers; popover shows photo, scientific name, planted-on date, warranty badge.

Photos

Color-coded by kind: before / after / progress / issue / property. Pairs unlock a slider modal.

Service history

A single pin at the property point; popover lists every visit in reverse chronological order.

Treatments — fertilizer

Green markers for fertilizer applications. Estimate zones tied to a visible treatment get a dashed orange stroke.

Treatments — herbicide

Amber markers; popover shows products with EPA signal-word badges, area treated, and an REI expiry warning if active.

Treatments — insecticide

Red markers with the same EPA payload as herbicide markers; pairs with the chemical-compliance disclosure flow.

Treatments — fungicide

Purple markers for fungicide applications, with REI warnings the same as the other regulated categories.

What ships in the module

Six pieces that turn the property into a living asset

None of these are bolt-ons. They share one map, one timeline, one set of layer toggles — so the customer learns the surface once and explores from there.

Service zones from accepted estimates

The same polygons your office draws in the estimate map editor, surfaced for the customer to see.

  • Drafts, rejected, and cancelled estimates stay private
  • Sent / viewed / approved / done states all render
  • Color-coded by zone type — lawn, beds, hardscape, etc.

Plant tagging — by crew, customer, or office

Every tagged plant carries a photo, scientific name, planted-on date, and a warranty badge if applicable.

  • Color-coded markers; popover renders the original capture photo
  • Customer self-tag mode: click on the map to drop a marker, name + notes modal opens
  • Crew tagging via the field PWA pairs with the office pin-recovery flow

Before/after photo slider

Pairs of before/after shots at the same coordinate become a draggable split-divider modal — proof, not paperwork.

  • Server-side pair grouping: same job, ~10m geo cluster, opposite kinds
  • Drag-to-split divider over the two photos
  • Progress and issue photos still render as standalone markers

Service history pin + timeline scrub

A single property pin lists every visit in reverse chronological order. The vertical scrub on the right rewinds the entire map to any date in the property's history.

  • Drag the scrub to filter every layer at once
  • Bounds come from the backend — first event to most recent
  • Empty states gracefully degrade if the property isn't located on the map yet

Fertilizer & chemical treatments overlay

Every regulated application shows up as a marker the customer can tap — with the same EPA payload that fires from chemical-compliance disclosures.

  • Color-coded by category: fertilizer, herbicide, insecticide, fungicide
  • Popover surfaces product, EPA signal word, area treated, REI expiry warning
  • Estimate zones tied to a visible treatment get a dashed orange highlight

Multi-property selector + private-by-default

Customers with more than one property switch with a dropdown at the top of the page. Authorization is per-property, scoped to the Hub session — wrong customer or wrong org returns a clean 404, never a 403.

  • Property dropdown auto-appears when the customer has >1 on file
  • HttpOnly Hub-token cookie handles auth — no shared URLs leak access
  • Cross-org and cross-customer attempts return 404 (defense in depth)
Why customers actually come back

Engagement that compounds, not a portal that goes stale

Static portals get one visit, then forgotten. The map keeps customers tagging, scrubbing, and showing neighbors — and that turns into renewals and referrals.

What customers see, and what they don't

Private by default, transparent by intent

Drafts and internal staging never reach the customer. Approved work, completed treatments, and customer-disclosed records do. The line is drawn at workflow state — not at a manual toggle you have to remember to flip.

Surface Customer can see Stays private
Estimate zones Sent · Viewed · Approved · Done Drafts · Rejected · Cancelled
Treatments Completed applications Planned · In-progress (office staging)
Plants Active plant records Removed plants
Photos JobPhotos and PropertyPhotos with coordinates Untagged or unattached photos
Cross-tenant access 404 on every cross-org or cross-customer attempt
Questions we hear

Living Property Map FAQ

What plan is the Living Property Map on?
Every plan. The Living Property Map ships on Starter and is included in Professional and Enterprise — no add-on fee. It's part of the Client Hub experience your customers already get.
Can customers see drafts of estimates I haven't sent yet?
No. Service-zone polygons only render for estimates in the sent, viewed, approved, or done states. Drafts, rejected, and cancelled estimates stay private to your back office.
What if a customer has more than one property?
A property dropdown appears at the top of the map page so the customer can switch between any properties on file. Each property has its own zones, plants, photos, history, and treatments — and its own timeline.
Do customers need to download an app or create an account?
No. The Living Property Map opens inside the Client Hub, which uses no-login access — a short code or magic link by email or SMS. Customers can pin the Hub to their home screen as a Progressive Web App, but no install is required.
Can customers tag their own plants on the map?
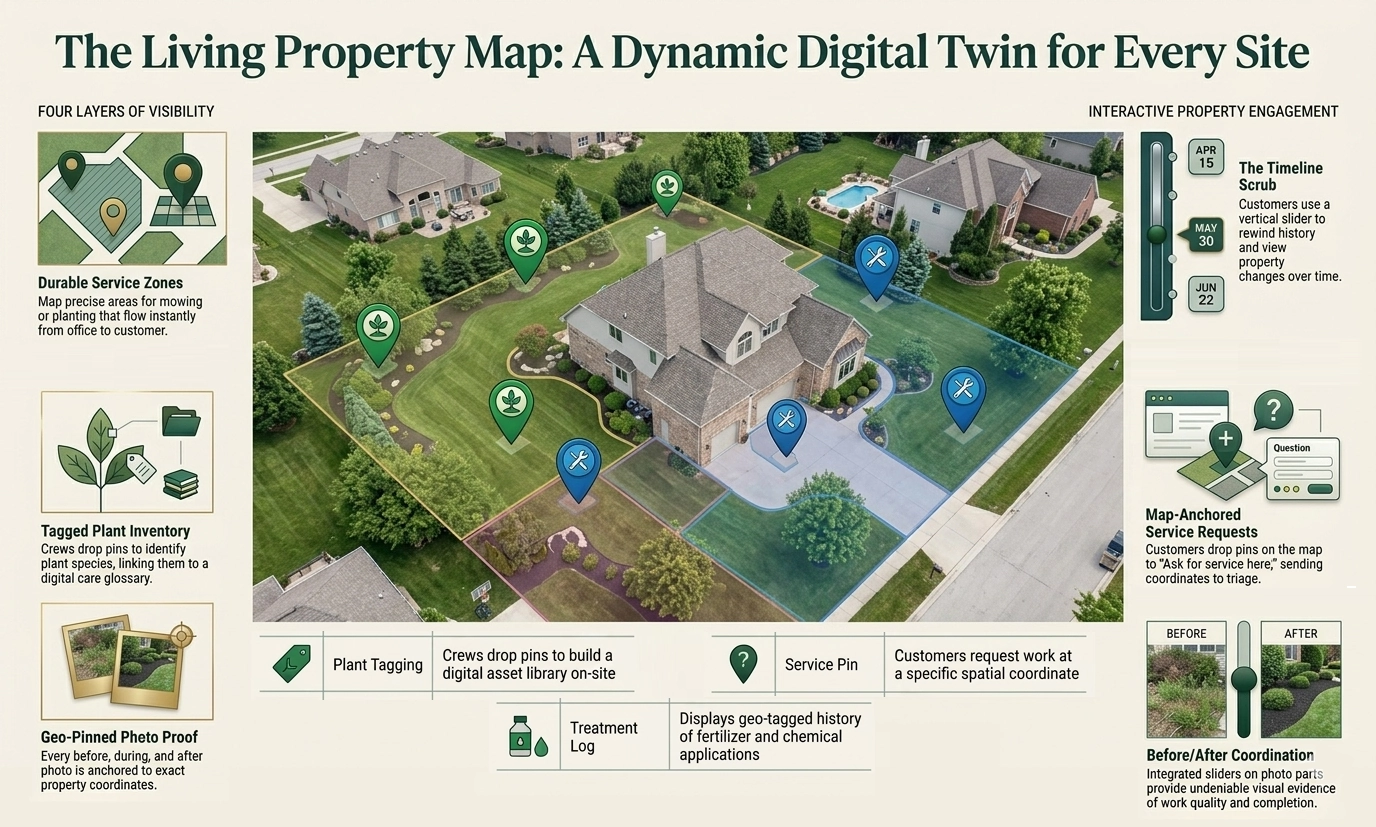
Yes. The "Tag plant" button enables click-to-place mode — customers click on the satellite map and a name + notes modal appears. Customer-tagged plants show up alongside ones added by your crews or office staff, with no glossary lookup required (so Starter customers can tag freeform).
Get Started

See the map run on a real property

30-minute walkthrough — bring an address and we'll spin up zones, photos, and treatments live on the satellite view so you can see exactly what your customers would see.